

MTS — Market Structure Analytics for Indian Markets
MTS (Market Trend Structure) is a rule-based market structure, trend, and momentum analysis platform designed to help traders and investors interpret price behaviour objectively.
Instead of relying on tips, predictions, or emotional reactions, MTS presents trend direction, key price interaction zones, and market conditions in a visual and structured format. This helps users develop discipline and clarity in their market analysis.
MTS is a decision-support and learning tool. It does not provide investment advice, trading recommendations, or guaranteed outcomes.
Rule-Based Market Structure & Technical Analysis for Indian and Global Markets
Navigating the noise of the stock market requires more than just standard indicators. MTS provides a comprehensive, rule-based approach to market structure trading, designed specifically for the volatility and liquidity of Indian markets. Our system removes the guesswork, allowing you to focus on objective price action.
Automated Trendlines with Demand and Supply Zones
Stop manually drawing subjective trendlines. The MTS system automates Nifty 50 market structure analysis, identifying higher highs, lower lows, and critical pivots in real-time. This ensures your directional bias is always aligned with the actual market flow, not an outdated opinion.
Real-Time Momentum Scanner for NSE Equities
Timing is everything. Our real-time momentum scanner for NSE equities continuously monitors hundreds of stocks to pinpoint exactly where volume and price velocity are accelerating. This allows you to deploy capital efficiently into assets that are actually moving.
Nifty, Bank Nifty, Sectoral Intraday Scanner & Top-Down Alignment
Bank Nifty moves fast, requiring top-down timeframe alignment to avoid false breakouts. The MTS Bank Nifty intraday scanner filters out the noise by cross-referencing lower timeframe triggers with higher timeframe structural support.
Identifying Break of Structure (BOS) and Liquidity Sweeps
Within Bank Nifty, identifying institutional footprints is critical. Our algorithms are tuned to detect a valid Break of Structure (BOS) and highlight liquidity sweeps, ensuring you are trading alongside smart money rather than becoming retail liquidity.
Core Philosophy
Structure Over Emotion, Confirmation Over Guesswork, Defined Risk Over Hope.
MTS eliminates random decision-making by providing rule-based trade identification, invalidation levels, and strength scoring.
Contact Us
Why MTS Exists
MTS is built to simplify market structure, momentum, and risk assessment into a single visual framework for confident decision-making.
Eliminate Analysis Paralysis
All the data you need is synthesized into a clean visual dashboard.
Psychological Edge:
When Trend, Momentum, and Structure align, your conviction increases and your stress decreases.
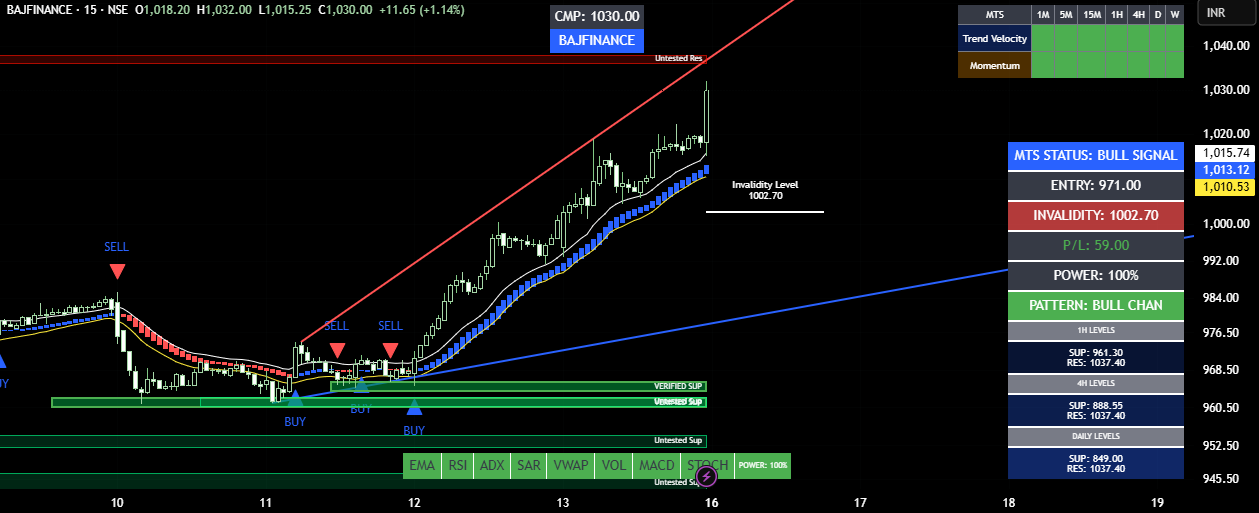
Why MTS Exists
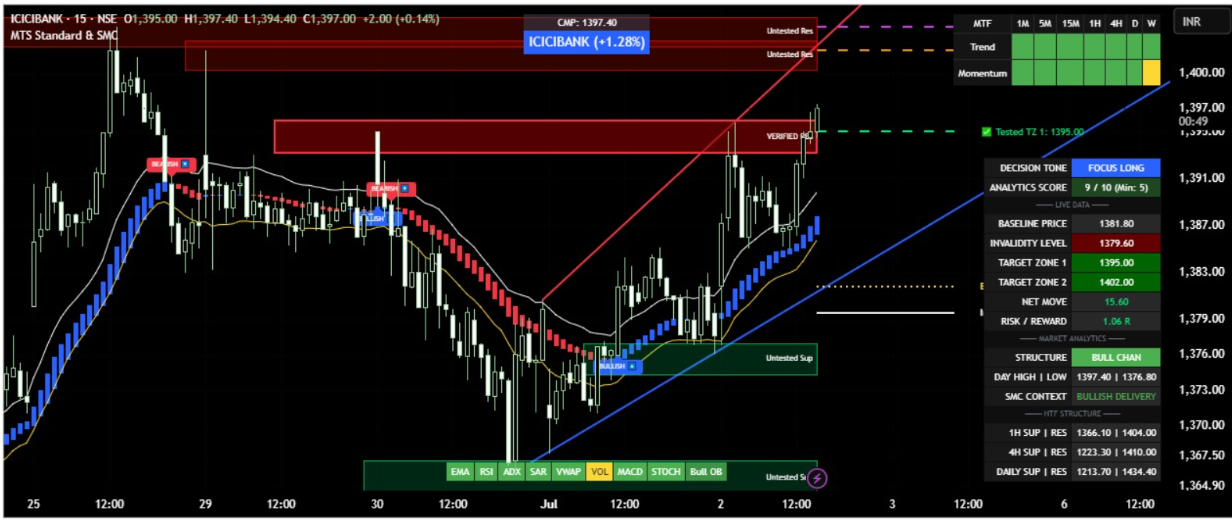
MTS Provide a complete 360- degree view of market dynamics through seven core pillars.
1. Integrated Trend and Momentum Veloctiy.
2. Automated Support and Resistance Zones.
3. Automated Trend Lines.
4. Multi-Timeframe(MTF) Strength Matrix.
5. Intelligent Pattern Recognition.
6. Dynamic Invalidity Levels
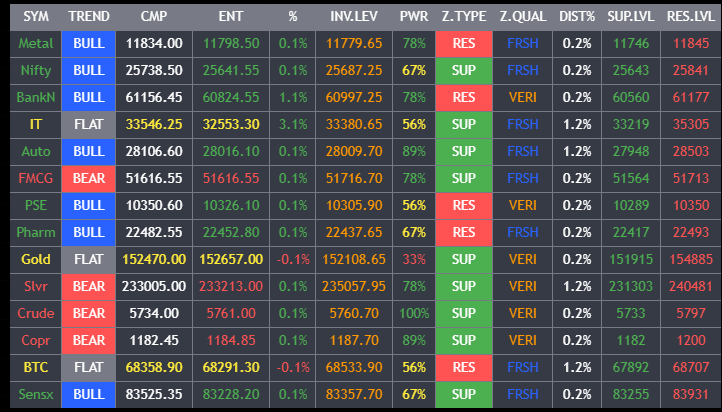
7. Multi-Asset and Sectoral Scanner.
A Framework, Not a Black Box
MTS does not generate trade tips or predictions. It provides analytical context using trend identification, momentum validation, automatic structure mapping and disciplined risk assessment.
How the MTS Scanner Is Used
The MTS Scanner is designed to reduce market noise by highlighting areas where structure, alignment, and participation are present. It does not generate trade signals.
What is the Multi-Timeframe Trend Matrix?
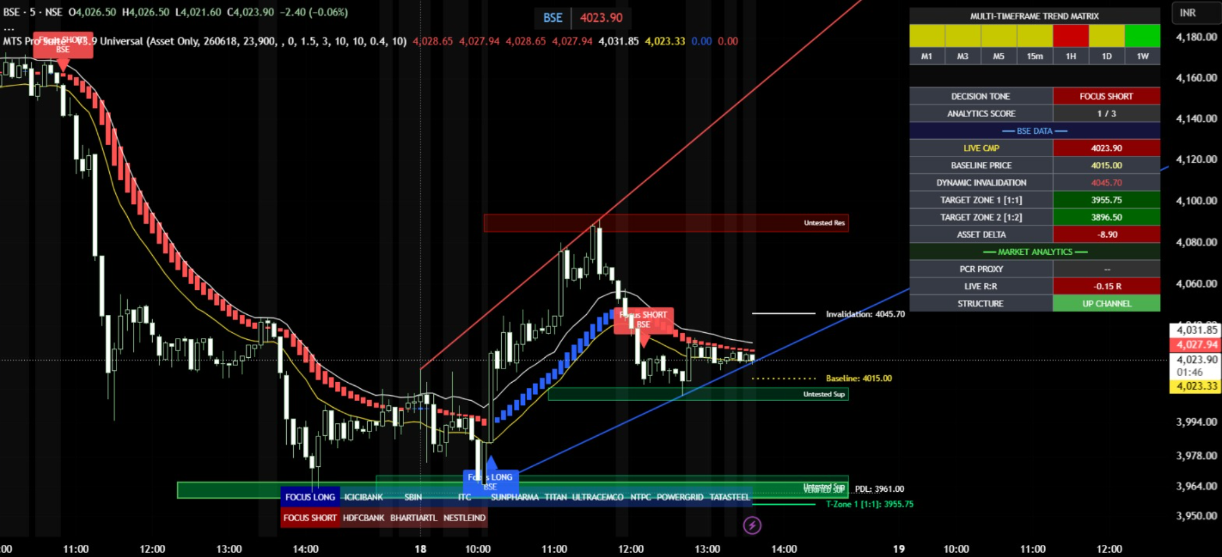
To succeed in day trading, your setups must align with the broader market momentum. The Multi-Timeframe Trend Matrix is a live, color-coded heatmap built into the dashboard that provides an instant visual snapshot of market structure across all key intervals, from the 1-minute chart to the weekly timeframe.
Provides instant visual confirmation of both macro and micro trends.
Helps filter out low-probability, counter-trend setups.
Ensures you are always trading on the right side of institutional momentum.
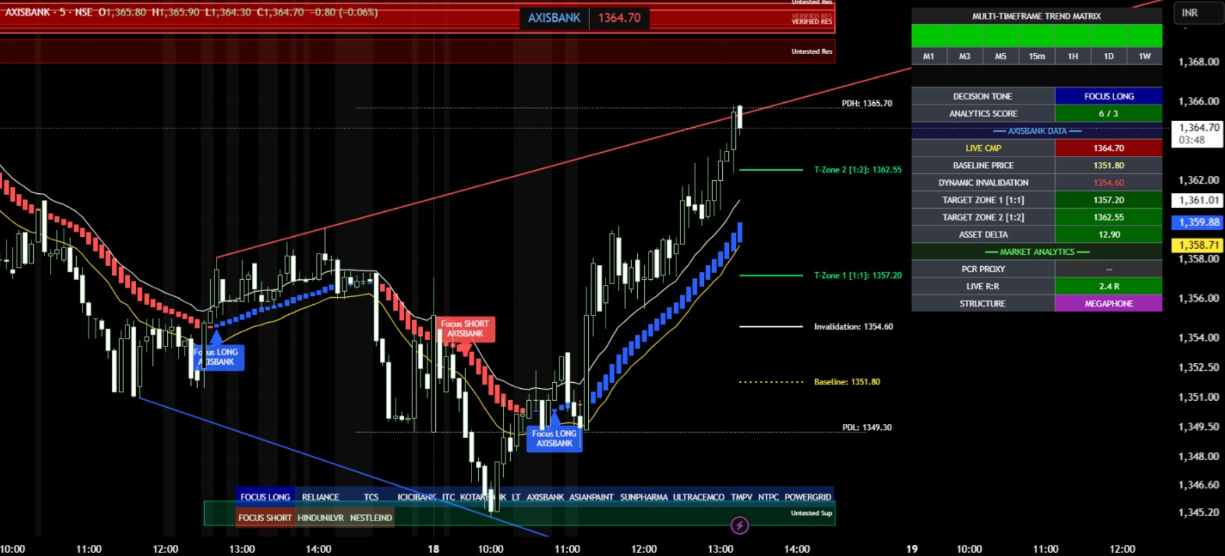
How Do We Define the No-Trade Zone?
Protecting capital during flat or choppy markets is just as important as catching breakouts. MTS uses dynamic parallel tracking lines to map market momentum. When price compresses between these boundaries, the system identifies a No-Trade Zone, which is shown as yellow color in MTF Trend Matrix, Analytics Score.
Visually isolates periods of low momentum and price compression.
Prevents capital bleed during unpredictable market conditions.
Clarifies exactly when to step aside and wait for structural breakouts.
Why Choose Decision Support Analytics Over Signals?
Blindly following generic buy or sell signals rarely leads to consistent profitability. MTS acts as a decision support system by processing a confluence of up to 18 technical indicators and presenting the information through an intuitive analytical dashboard.
Provides deep market context rather than blind execution alerts.
Synthesizes complex technical data into a clean, actionable dashboard.
Empowers traders to make informed, high-probability decisions.

How Are Options Integrated into the Chart?
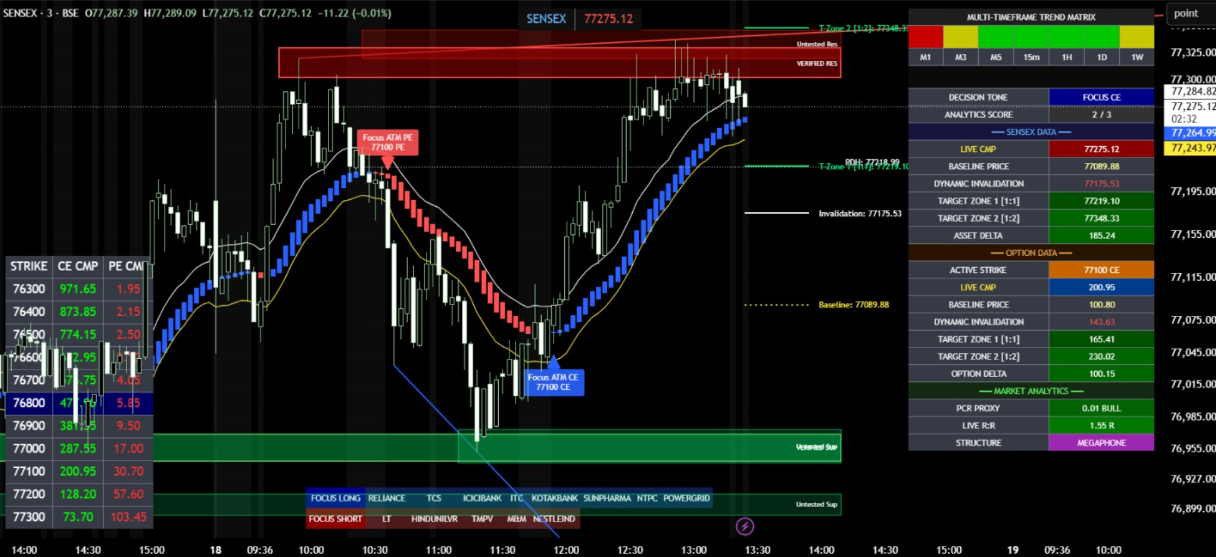
The MTS Universal Suite integrates real-time options data directly into the trading interface. Traders can view Active Strike, Call/Put CMP, Option Delta, and related analytics alongside the underlying asset's price action.
Eliminates the need to switch between charts and option chains.
Calculates dynamic invalidation and target zones for active options.
Creates a centralized command center for seamless execution.
Disclaimer
Important Disclosure & Risk Warning:- "Investment in securities market are subject to market risks. Read all the related documents carefully before investing."
Nature of Software:- The MTS System is a proprietary technical analysis and data-visualization tool developed for the TradingView / MT4 platform. It is an educational and analytical tool intended to assist users in their independent market research.
No Investment Advice:- This website and the MTS software do not provide investment advice, financial planning, or stock recommendations. We are not SEBI Registered Investment Advisers (RIA) or Research Analysts (RA). Any signals, labels, or alerts generated by the software are strictly the result of automated mathematical algorithms and do not constitute a recommendation to buy, sell, or hold any security.
User Responsibility:- Trading involves significant financial risk. The developer of MTS shall not be liable for any financial losses or damages resulting from the use of this software. Users are solely responsible for their trading decisions and are encouraged to consult with a certified financial professional before executing any trades.
Accuracy of Data:- While the logic is built on rigorous testing, we do not guarantee the accuracy or timeliness of third-party data feeds. Past performance of any automated logic is never a guarantee of future results.
