

How MTS Works
How MTS Works
MTS (Market Trend System) is a market-structure and risk-evaluation framework. It helps users understand what the market is doing before taking decisions.
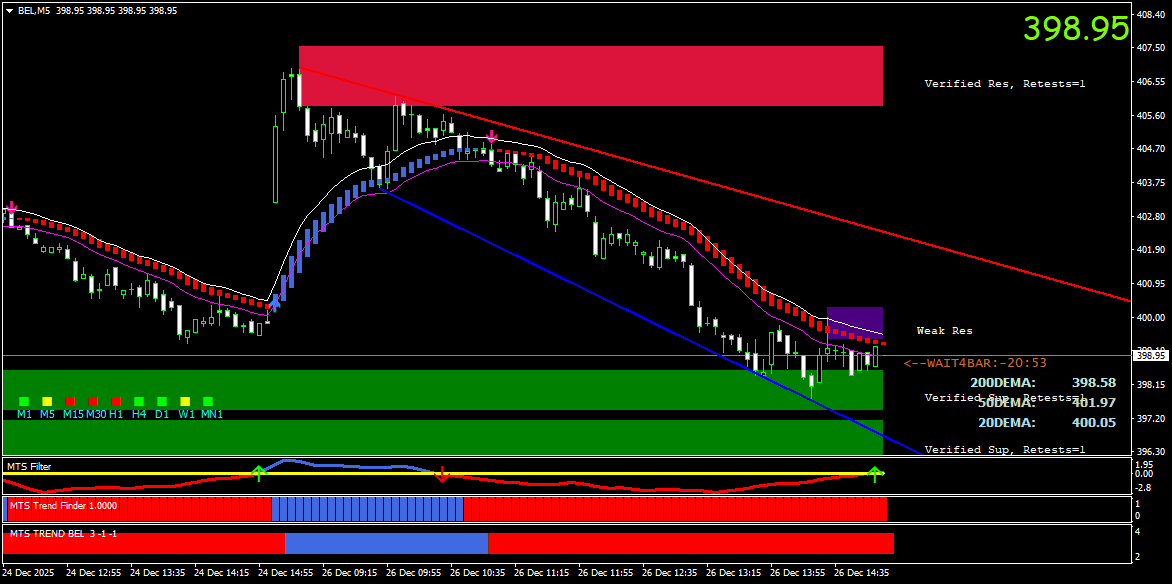
MTS Market Structure
The MTS (Market Trend Structure) Suite is a high-performance technical analysis software designed for the TradingView platform. It is built to assist traders in identifying market structure, trend velocity, and institutional supply/demand zones through objective mathematical algorithms.
The chart illustrates how MTS interprets price behaviour using automatically generated trendlines, structural zones, and trend-momentum filters.
- Red trendline: Automatically projected resistance
- Blue trendline: Dynamically identified support
- Green zone: Structural demand area
- Trend & momentum filters: Validate participation strength
- No manual plotting: Entire structure adapts automatically
This illustration is for explanation only. It is not a trade signal or recommendation.
How Our Automated Supply and Demand Zone Indicator Works on TradingView
MTS removes the tedious process of manually scanning charts for trade locations. Our automated supply and demand zone indicator for TradingView mathematically calculates where institutional buying and selling originated, painting these precise zones directly onto your charts in real-time.
Mapping Order Blocks and Institutional Supply & Demand
Not all price drops are equal. The system specifically targets high-volume order blocks and institutional supply and demand zones, filtering out minor retail support and resistance levels that are prone to failing.
Differentiating Between Fresh vs. Verified Demand Zones
A zone tested five times is dangerous; a zone tested once is an opportunity. MTS automatically differentiates between fresh vs. verified demand zones, allowing you to prioritize high-probability setups and avoid areas where institutional orders have already been depleted.
The Multi-Timeframe Trend Indicator Framework
The core engine of MTS relies on a robust multi-timeframe trend indicator framework. It evaluates the momentum and structure of your chosen asset across four distinct timeframes simultaneously, presenting the data in a simple, unified dashboard panel.
Automated Trendline Breakout Detection Rules
Breakouts are highly profitable but often fake out retail traders. Our automated trendline breakout detection rules wait for strict closing criteria and momentum validation before signaling a legitimate breakout, drastically reducing your exposure to false moves.
Full Explanation Sheet – How to Use MTS
1. Market Environment Identification
Markets move through different phases. MTS classifies trending, momentum-driven, or sideways environments.
- Trending environments support continuation logic
- Sideways environments require restraint
- Same approach is not applied everywhere
2. Multi-Timeframe Alignment
MTS evaluates structure across higher, intermediate, and lower timeframes.
- Alignment improves clarity
- Conflict increases noise
- Alignment prioritised over frequency
3. Momentum Strength Evaluation
MTS evaluates whether momentum supports continuation or is weakening.
- Strong momentum confirms participation
- Weak momentum signals caution
- Avoid low-quality conditions
4. Structural Zones & Trendlines
Support-resistance zones and trendlines are identified automatically.
- Zones define risk invalidation areas
- Trendlines adapt dynamically
- No manual plotting required
5. Risk-First Framework
Risk assessment is central to MTS participation logic.
- Risk defined before opportunity
- Capital protection prioritised
- Standing aside is valid
6. Sectoral & Multi-Asset Scanning
MTS scans across sectors and instruments displaying structure.
- Scanning reduces noise
- Helps prioritise attention
- Does not encourage over-activity

Disclaimer
Important Disclosure & Risk Warning:- "Investment in securities market are subject to market risks. Read all the related documents carefully before investing."
Nature of Software:- The MTS Advanced Scanner is a proprietary technical analysis and data-visualization tool developed for the TradingView platform. It is an educational and analytical tool intended to assist users in their independent market research.
No Investment Advice:- This website and the MTS software do not provide investment advice, financial planning, or stock recommendations. We are not SEBI Registered Investment Advisers (RIA) or Research Analysts (RA). Any signals, labels, or alerts generated by the software are strictly the result of automated mathematical algorithms and do not constitute a recommendation to buy, sell, or hold any security.
User Responsibility:- Trading involves significant financial risk. The developer of MTS shall not be liable for any financial losses or damages resulting from the use of this software. Users are solely responsible for their trading decisions and are encouraged to consult with a certified financial professional before executing any trades.
Accuracy of Data:- While the logic is built on rigorous testing, we do not guarantee the accuracy or timeliness of third-party data feeds. Past performance of any automated logic is never a guarantee of future results.